 Index
Index
- Introduction
- Tool modes
- Change in wavelength mode
- Wavelength mode
- Sky mode
- Absorption mode
- Final comments
Introduction
For the Blue Tunable Filter (BTF), the FWHM attainable is directly defined by the observing wavelength (see Tunable Filters Web page). In other words, for each wavelength only one passband FWHM is available, hence this tool has no sense for the BTF.
This tool has been developed to help the observer to select the central wavelength and FWHM of the Red Tunable Filter (RTF) of the OSIRIS instrument.
The OSIRIS Tunable Filter Setup tool has been developed by the author as a Java program to be executed through a web navigator.
At present it can be accessed at https://gtc-phase2.gtc.iac.es/science/OsirisETC/html/TFSetup.html. To run the application Java JRE 1.6 or later should be installed on the client machine. Also, the JNLP MIME type should be set to application/x-java-jnlp-file to be opened by javaws on the client navigator.
OSIRIS has two TFs: blue and red. At this moment (February 2010) blue TF has not been commissioned yet. Visit the GTC OSIRIS page to check TF availability.
Tool modes
There are four modes:
- Change in wavelength: compute wavelength as a function of distance to optical centre
- Wavelength: gives the possible TF FWHMs for the selected wavelength
- Sky: plots the sky spectrum and the profile of the TF
- Absorption: plots the atmosphere transmission and the profile of the TF
Change in wavelength
There are three options:
- Computes wavelength at a given distance from the optical center for a tuned central wavelength.
- For a given central wavelength, computes the radius at which a given wavelength will be transmitted.
- Computes the wavelength to which to tune the TF at a given radius and wavelength at that radius
Wavelength mode
OSIRIS has two tunable filters, one for the blue range (? 450 nm - 671 nm) and another for the red range (? 651 nm - 934.5 nm).
A tunable filter is an interference system which transmits a certain series of wavelengths, depending on the separation between plates (gap).
For a given gap the transmitted intensity is of the form shown in the figure:
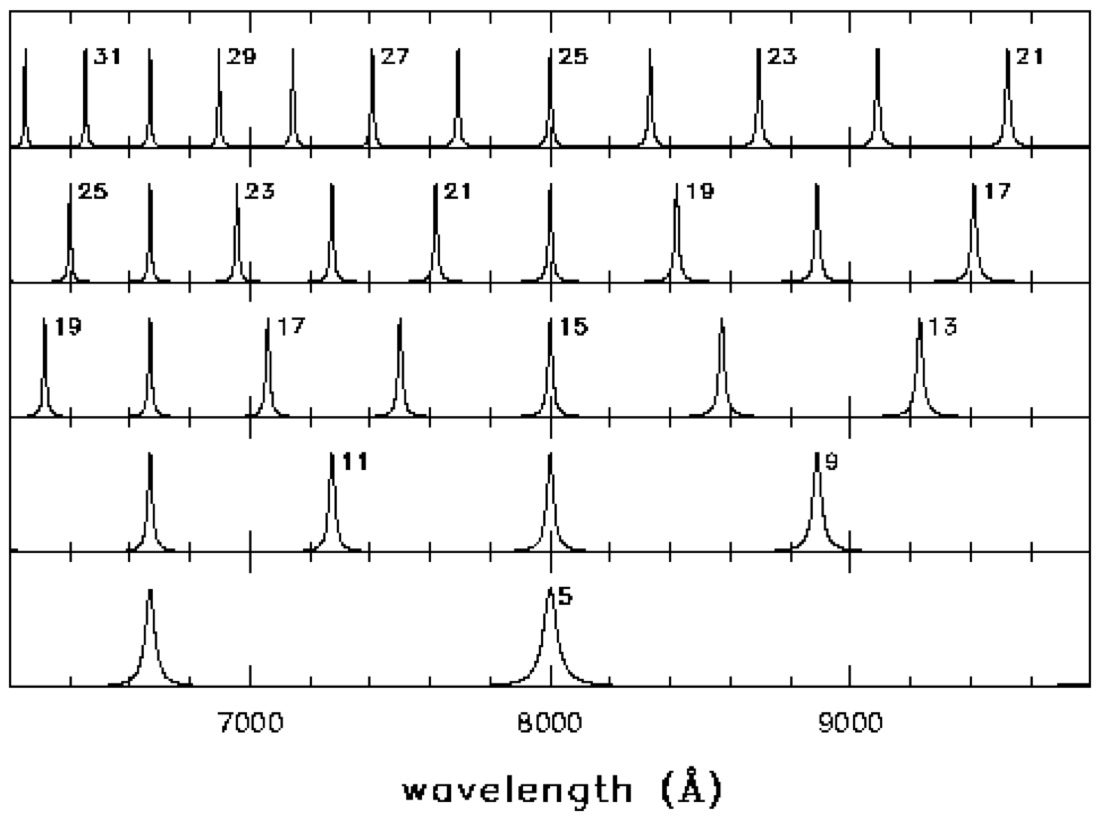
The distance between two consecutive maxima is called Free Spectral Range (FSR) and the FWHM of the maxima determine the TF band-pass.
To isolate a single order a filter is needed, which is called Order Sorter Filter (OSF). Using an OSF it then possible to guarantee that only a FSR is transmitted to the detector.
If the OSF is narrow it is possible to isolate orders of high spectral resolution; on the contrary, if the OSF is wide, only the lowest spectral resolution configurations can be tuned.
In practice, for a user-selected wavelength - FWHM pair the FSR is fixed and therefore, to observe a single order, an OSF with a width smaller than the FSR should be available. Note that the available set of OSIRIS OS filters is limited and thus, the range of possible FWHMs is limited.
This mode takes into account the TF behaviour and, for a given wavelength it computes the possible choices for the TF FWHM. For each possible FWHM the tool finds the corresponding OS (from the list of available filters). Visit the Blue OS and Red OS web pages for an updated list of filters.
Sky mode
The user selects a central wavelength and filter FWHM. The FWHM is recomputed to match the nearest available for that central wavelength and the TF transmission profile is computed and plotted (blue line) through a Free Spectral Range.
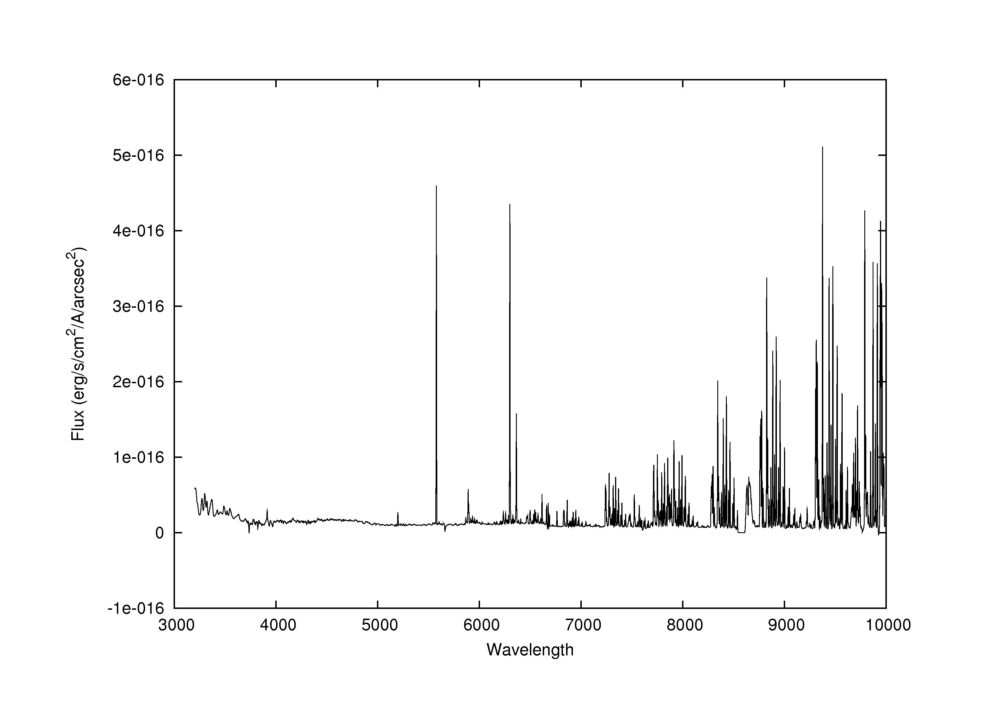
The night-sky spectrum is plotted (black line) in an arbitrary scale. The relative intensity of sky lines is real.
If there is an Order Sorter filter available, two green vertical lines are plotted, indicating the tunning range for that filter. Note that these lines do not represent the OS filter width.
A message indicating the final FWHM and FSR is shown. If no OS filter is available, a warning is output.
The night-sky spectrum used is from (Hanuschik, R.W. , 2003, A&A, 407, 1157) which is a high-resolution flux-calibrated spectrum from Paranal.
Absortion mode
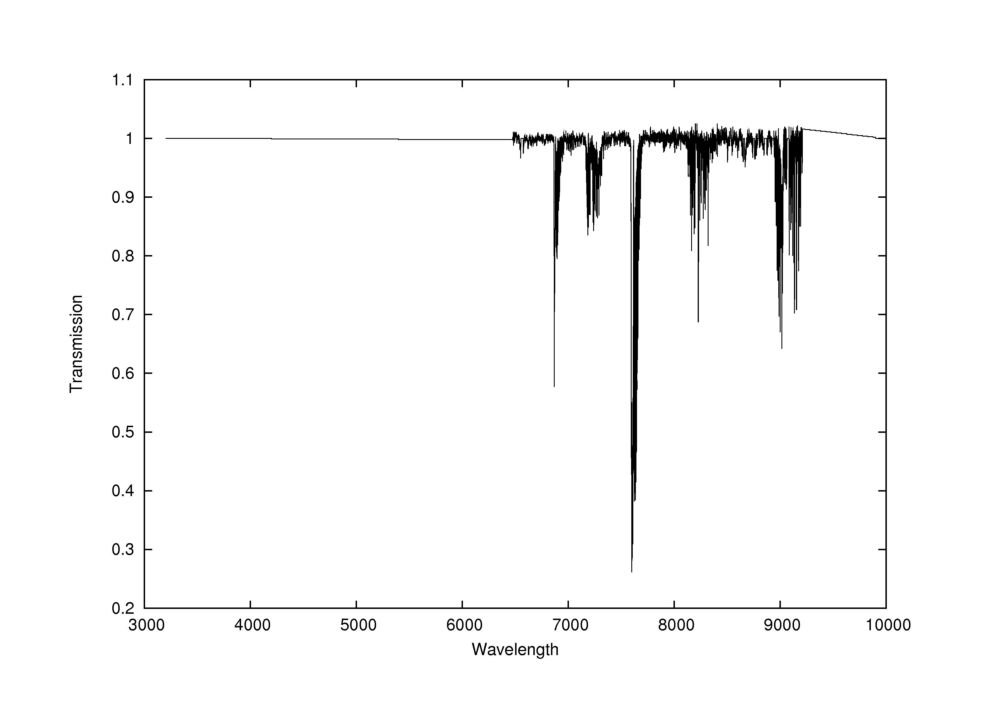
This mode is similar to the Sky mode but the atmospheric transmission is plotted instead of the night-sky spectrum.
The atmospheric transmission used is shown in the following figure:
Final Comments
The author (J. Ignacio Gonzalez-Serrano) is the only responsible for this tool.
Please contact the author (gserrano@ifca.unican.es) for comments, suggestions, complaints, and errors or inconsistencies found; they are all welcome
Last modified: 27 May 2013


